
Comparing Versions of Excel: Which Version is Best?
.png)
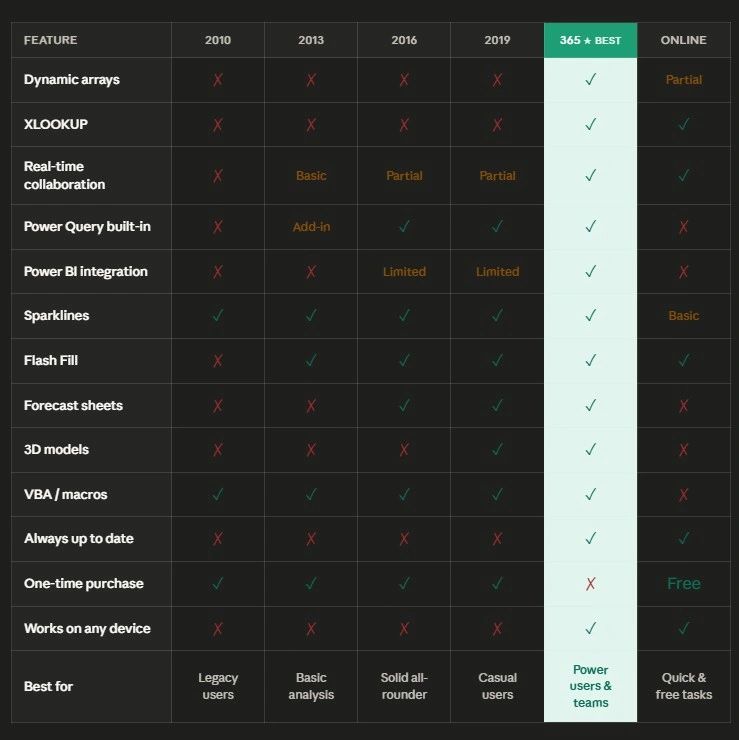
Check out our Excel version comparison chart below to determine with Excel version is best. Microsoft Excel has been a staple for businesses and professionals worldwide since its release in 1985. With each version, Excel has evolved, introducing new features, tools, and capabilities that enhance data analysis and streamline workflows. But how do the different versions of Excel compare? And what key features make each version stand out?
In this article, we'll explore the differences between some of the most notable Excel versions, focusing on their unique features and improvements. By understanding these distinctions, you'll be better equipped to choose the right version for your needs and make the most of Excel’s powerful functionality.
Excel 2010
Key Features:
- Sparklines: One of the standout additions in Excel 2010, sparklines are tiny, cell-sized charts that visually summarize data trends in a compact format. They are ideal for spotting trends without taking up too much space.
- Slicer for PivotTables: Slicers allow users to filter PivotTables visually, making data navigation faster and easier. This was a significant improvement for users who work extensively with PivotTables.
- Improved Conditional Formatting: Excel 2010 expanded the capabilities of conditional formatting, making it easier to highlight trends, apply color scales, and set up rules based on specific conditions.
- PowerPivot (Add-in): Excel 2010 introduced PowerPivot as a free add-in, which enables users to manage large datasets, create complex models, and integrate data from various sources.
Limitations:
- User Interface: The Ribbon, introduced in Excel 2007, was still maturing, and some users found it less intuitive than later versions.
- Collaboration: Collaboration features were still limited compared to cloud-based versions.
Excel 2013
Key Features:
- Flash Fill: This new tool automatically recognizes patterns in data and fills in columns based on your input. For example, if you have a list of first and last names, Flash Fill can automatically combine them or separate them based on a few sample inputs.
- New Chart Options: Excel 2013 added more chart types, including Combo Charts and improved options for customizing chart elements like titles and data labels.
- Data Model and Power Query Integration: Excel 2013 integrated PowerPivot and introduced Power Query, which provides tools for connecting, combining, and refining data from different sources.
- Recommended PivotTables: Excel now suggests suitable PivotTable formats based on your dataset, making it easier for beginners to visualize data insights.
- Online Collaboration: Excel 2013 improved cloud integration with OneDrive, enabling users to store and share their workbooks online more easily.
Limitations:
- Performance: While Excel 2013 introduced many powerful features, some users found performance lagging, especially when working with large datasets and complex formulas.
Excel 2016
Key Features:
- One-Click Forecasting: Excel 2016 introduced an easy way to create forecasts with a click, using built-in algorithms to predict future trends from historical data.
- New Functions: Excel 2016 added several new functions, such as
TEXTJOIN()andIFS(), which streamline formula writing and make calculations more intuitive. - Improved Data Import: Power Query, which was available as an add-in for Excel 2013, was fully integrated in Excel 2016, making it easier to connect and transform data from multiple sources.
- Tell Me Feature: This smart search feature helps users find specific commands and features without navigating through multiple menus.
- Real-Time Collaboration: While Excel 2013 improved cloud integration, Excel 2016 took it further by enabling real-time co-authoring with other users via OneDrive and SharePoint.
Limitations:
- Power BI Integration: Excel 2016 allowed some level of Power BI integration, but it wasn’t as seamless as in newer versions. Users often needed Power BI Desktop to fully leverage its capabilities.
Excel 2019
Key Features:
- New Charts: Excel 2019 added Funnel, Map, and Sunburst charts, enhancing data visualization options for users handling complex data.
- New Functions: The introduction of new functions like
CONCAT(),UNIQUE(), andTEXTJOIN()made it easier to work with text and remove duplicates. - Enhanced Power Query: Excel 2019 expanded Power Query capabilities, making data transformations faster and offering more customization options.
- PivotTable Enhancements: Users can now personalize PivotTables with custom sorting options, and new features allow for better data management and insights extraction.
- 3D Models: Excel 2019 introduced support for 3D models, enabling users to insert and rotate 3D objects in their workbooks for presentations.
Limitations:
- Limited Collaboration Features: Although Excel 2019 allowed for better cloud integration, its collaboration features were still not as advanced as the subscription-based versions.
Excel for Microsoft 365
Key Features:
- Dynamic Arrays: One of the most significant advancements in recent years, dynamic arrays allow a single formula to return multiple values. New functions like
SORT(),FILTER(),UNIQUE(), andSEQUENCE()rely on this feature to simplify complex tasks. - XLOOKUP(): Replacing the older
VLOOKUP()function,XLOOKUP()offers more flexibility, allowing for easier lookups without the limitations of column indexing. It also works in both vertical and horizontal directions. - Co-Authoring in Real Time: Excel for Microsoft 365 excels in real-time collaboration, enabling multiple users to work on the same document simultaneously. This is a critical feature for remote teams.
- Power BI Integration: With Excel 365, Power BI integration is seamless, allowing users to easily analyze and visualize data in Power BI and connect datasets.
- Always Up-to-Date: The major advantage of Excel 365 is that it continuously receives updates, ensuring users always have access to the latest features and security patches.
Limitations:
- Subscription Model: Excel 365 is only available via subscription, which can be a drawback for users who prefer one-time purchases.
Excel Online (Web Version)
Key Features:
- Accessibility: Excel Online is free and accessible from any browser. It’s ideal for users who need basic Excel functions without installing the desktop version.
- Real-Time Collaboration: Like Excel for Microsoft 365, Excel Online supports real-time co-authoring, making it a good option for quick, collaborative tasks.
- Basic Functions: It includes most essential Excel formulas and formatting options, making it a viable tool for lightweight tasks.
Limitations:
- Limited Features: Excel Online lacks some advanced functions like VBA, Power Query, and advanced chart types, making it less suitable for heavy data analysis or complex workbooks.
- Performance: Large files and complex formulas may slow down in the web version.
Which Version Is Best for You?
- For Businesses and Power Users: If you rely on advanced data analysis, automation, and collaboration, Excel for Microsoft 365 offers the best features, continuous updates, and seamless integration with Power BI and the cloud.
- For Casual Users: If you don’t need the latest features and prefer a one-time purchase, Excel 2019 is a solid option with plenty of functionality for everyday tasks.
- For Collaborative Teams: Excel Online or Excel 365 are your best bets if real-time collaboration is key to your workflow. Excel 365 adds more robust features, while Excel Online is a free, accessible alternative for simpler tasks.
Excel has come a long way since its early days, with each version offering improvements that cater to the needs of different users. Whether you’re a casual user, data analyst, or part of a collaborative team, understanding the differences between Excel versions can help you choose the best one for your work. If you want the latest features and collaboration tools, Excel for Microsoft 365 is the way to go. However, earlier versions like Excel 2016 and 2019 still offer powerful functionality for those seeking reliable, one-time purchase options.
Learn more about Excel here
How to make a project progress dashboard in Excel
All Excel formatting options explained
10 Tips for Creating Dashboards in Excel and Google Sheets
10 Excel Functions Every User Should Know